POV Virus

Imagine yourself as a cute little virus roaming in nature on a bright Sunday morning, when you suddenly find yourself within a human being, your brand-new host. Now, you are in a dilemma of whether you should replicate yourself by consuming host resources so fast that the host runs out of his fuel, or wait, strategize to live longer replicating for multiple generations? If you burn through your resources too quickly, you risk killing the host before you can move out, but if you play it slowly, you can use that host as a biological transport to spread further and start a global pandemic! You don’t have time to think otherwise the host’s immune system might be a threat to your survival. While this sounds like a fun strategy game from a virus’s perspective, it is a disaster for humanity. This is the Virulence-Transmission Trade-off [1, 2], and for humans, finding the "junction point" where these two forces meet is the key to understanding how pathogens navigate their own survival.
To understand the virus's profit margins, we look at the precise relationship detailed by evolutionary biologists [5]. In the world of viral evolution, success is measured by the Basic Reproduction Number R0 [1]:
R0 ++
Here, represents the transmission rate, and the denominator is dictated by three critical factors that act as a biological countdown clock [5]: is the host recovery rate driven by immediate action of immune cells to kill the pathogen [1], is the natural background mortality rate meaning how fast people normally die from old age, accidents, or other non-viral causes [5], and is the disease-induced mortality rate, or Virulence [3].
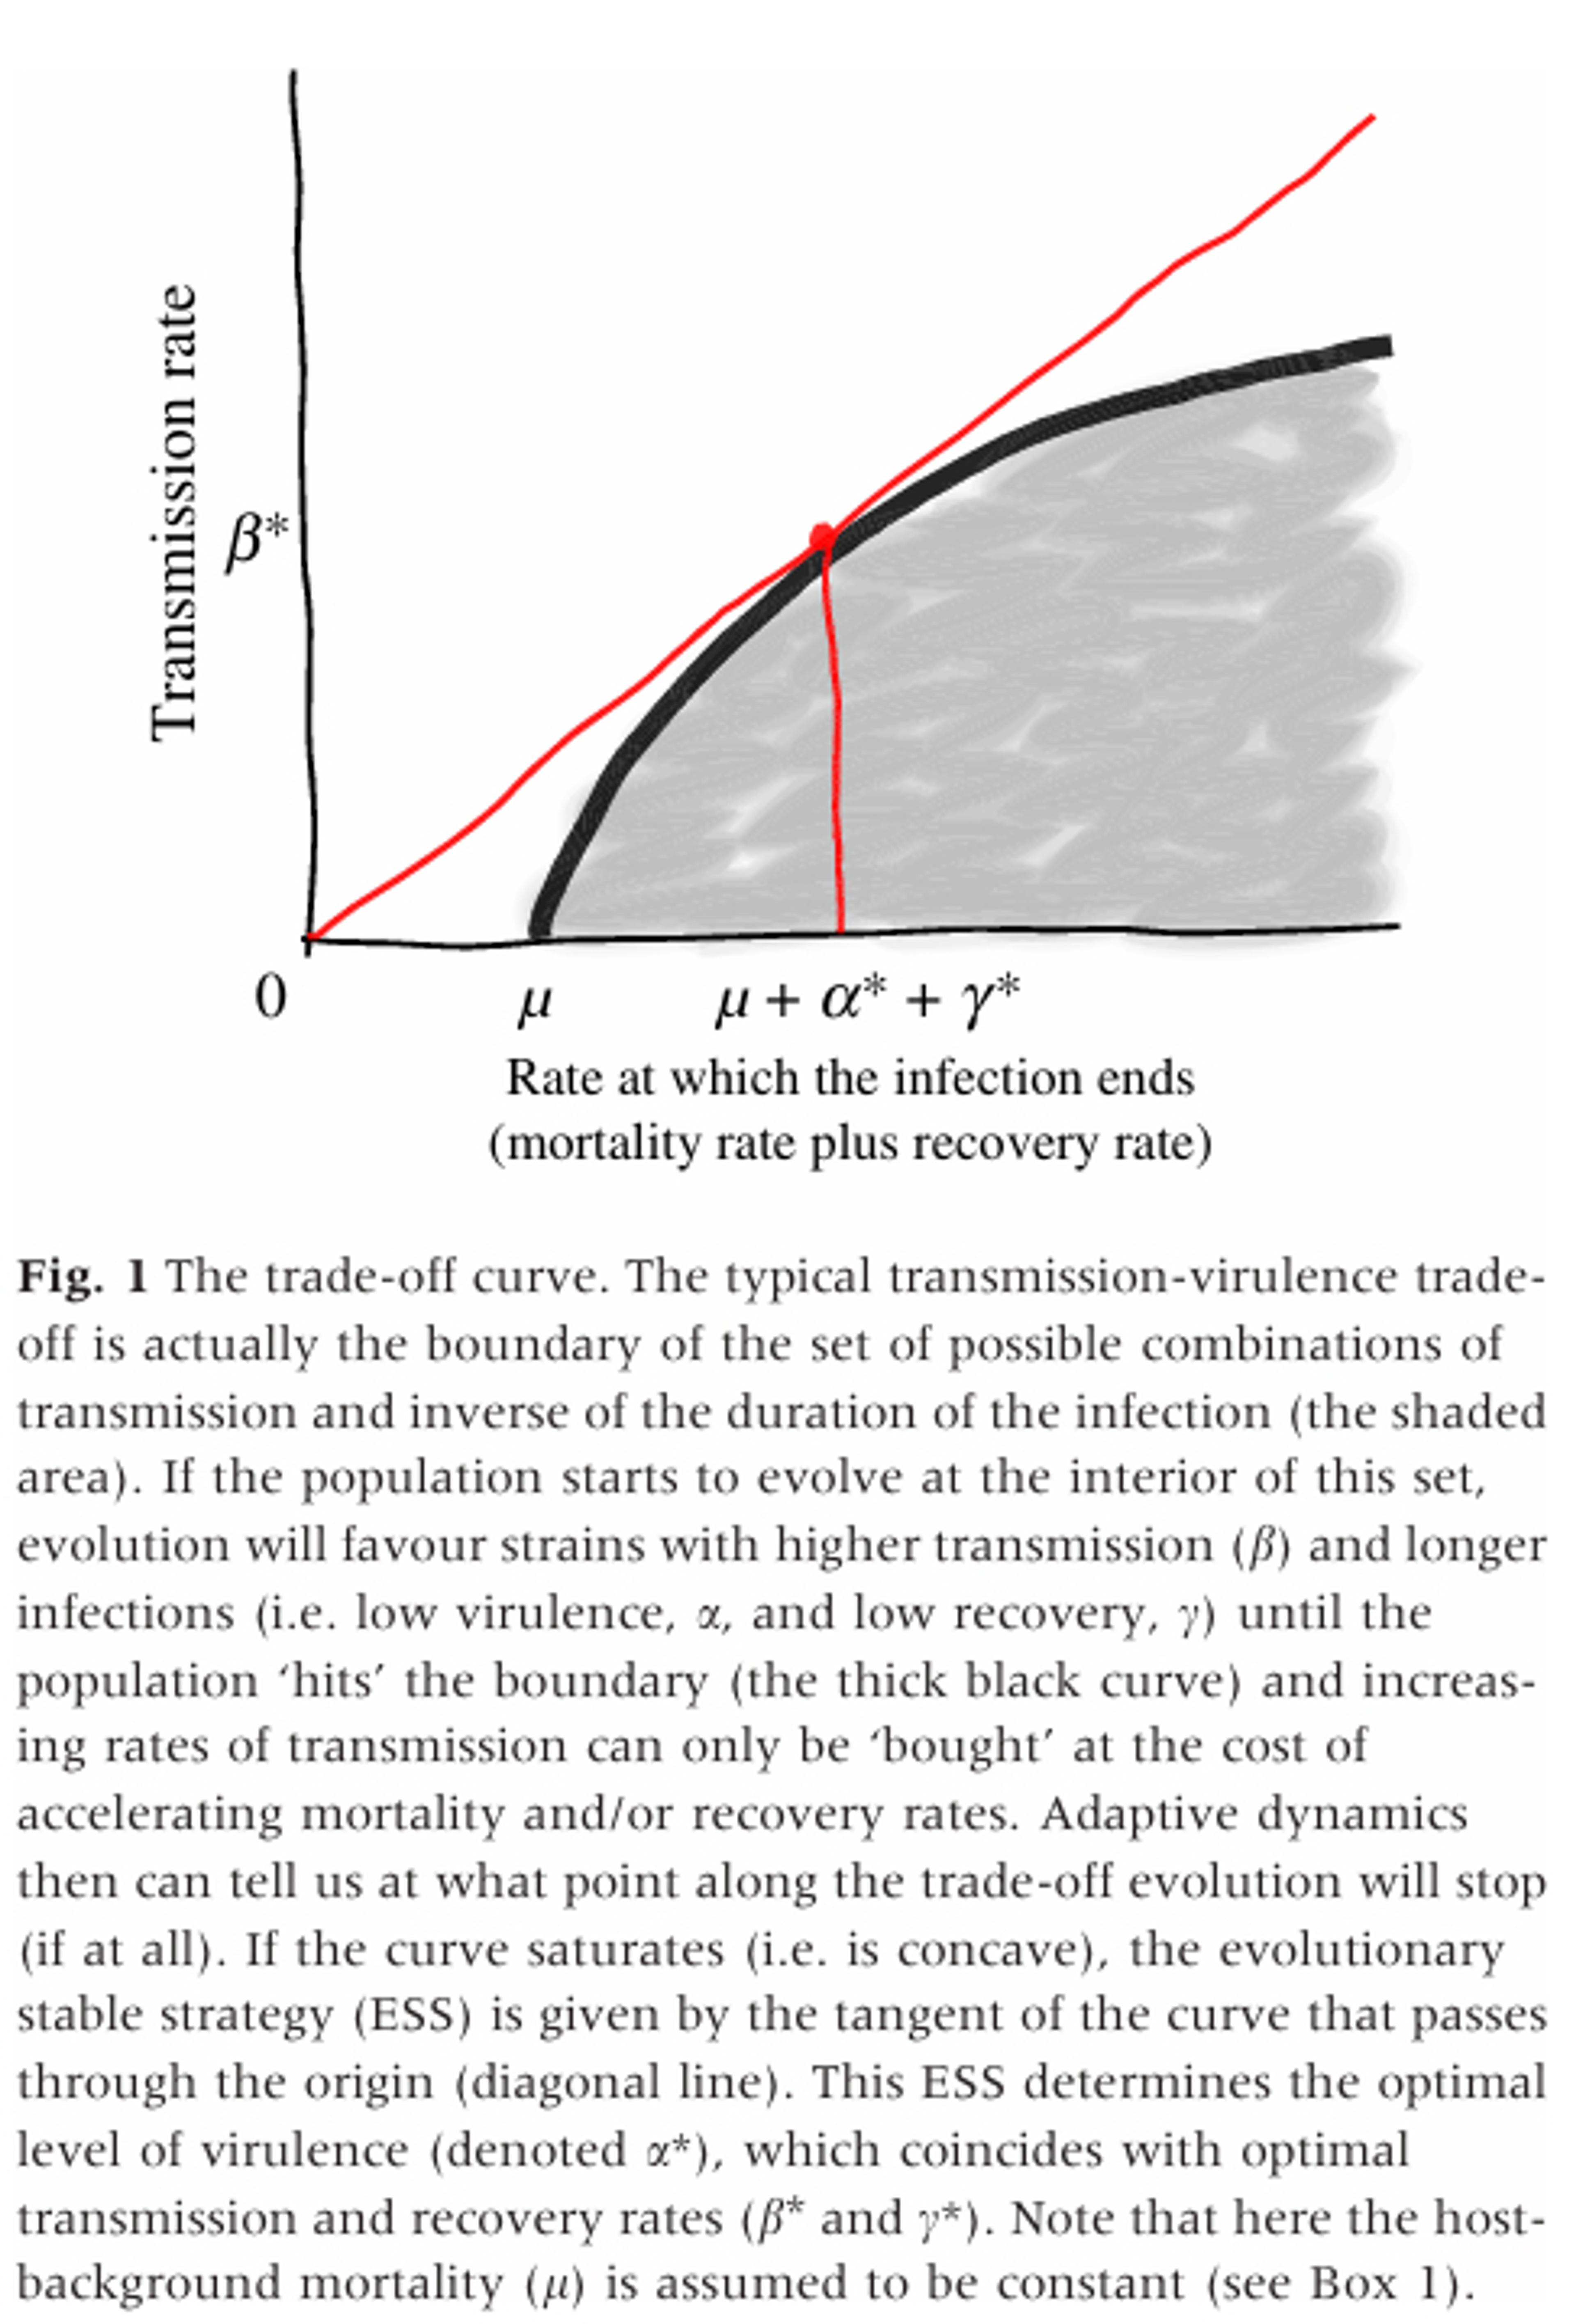
Figure 1: The Transmission-Virulence Trade-Off Curve [5].
The shaded area represents all possible combinations of transmission rate () and infection clearance rate ( + + ). As a pathogen population evolves, natural selection favors variants with higher transmission and longer infection durations until it reaches the outer boundary (the thick curve). Beyond this boundary, any increase in spread rate comes at the direct cost of increased host mortality or recovery rates.
This process is modeled using Adaptive Dynamics, which is the mathematical framework used to study how evolutionary strategies change over time as new viral mutations compete with established strains. Through this competition, the pathogen reaches an Evolutionary Stable Strategy (ESS), which is an optimal, unshakeable strategy that cannot be outperformed or replaced by any new mutant variant once the population adopts it.
On the graph, the pathogen hits this ESS at the exact point where a line from the origin forms a tangent to the curve (marked by the red dot). This tangent point identifies the optimal level of virulence (*) that maximizes the pathogen's overall spread ( *) relative to host recovery (*), assuming baseline host mortality (*) stays constant.
[5]
The moment you infect the host, you are racing against this combined denominator. If you replicate too slowly, the immune response eliminates you before you can shed enough copies to infect anyone else. To beat the clock, you must turn up your replication speed. However, turning up replication causes more damage to the host, which inherently spikes your virulence () [3].
This dynamic creates a complex Constrained Optimization Problem [3]. Because a virus typically needs a living, mobile host to move from person to person, transmission becomes a functional response of virulence [3], which is constantly squeezed by host immunity and survival rates [5]. The "Junction Point" occurs at the global maximum of the R0 curve, where the derivative dR0/d = 0 [3, 5], this is exactly when the Optimal Virulence [5] occurs. Where the marginal gain in spread from replicating fast enough to outrun the immune system is perfectly balanced against the marginal loss of shortening the host's lifespan. If a virus pushes even 1% past this optimum, its total "Market Share" begins to collapse as it burns through its host population too fast and self-extinguishes.
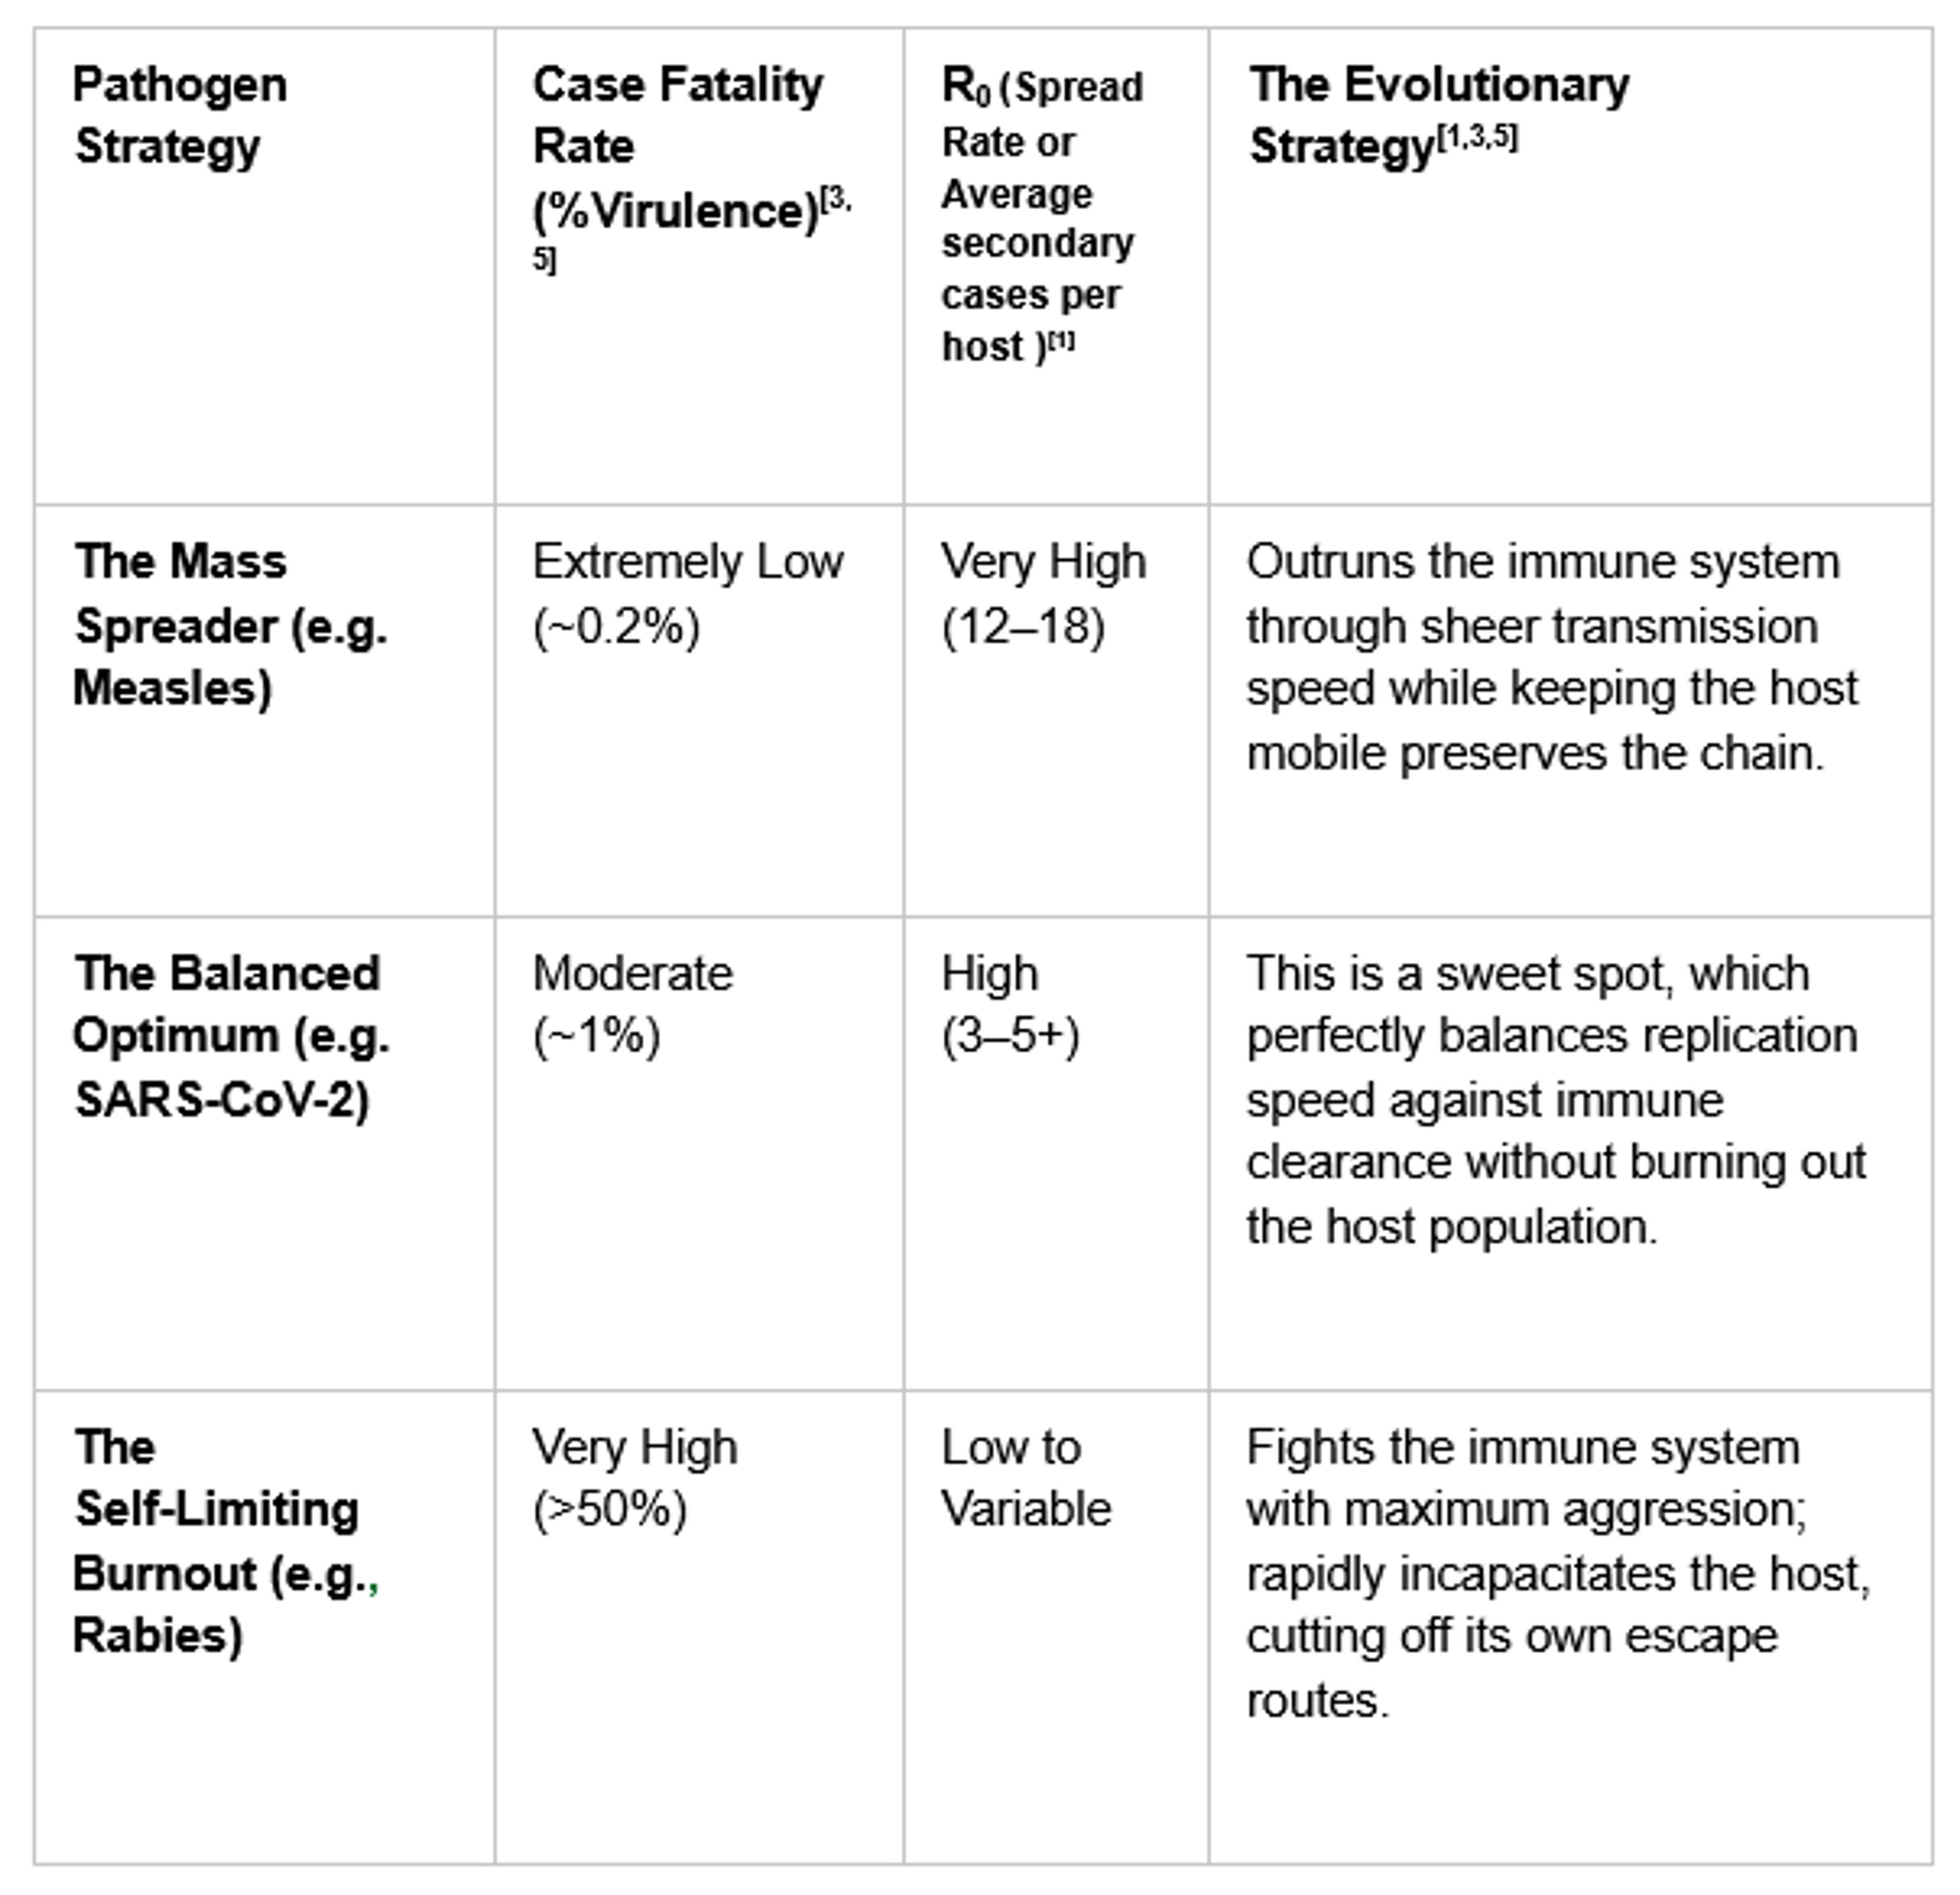
Let’s talk about the celebrity virus SARS-CoV-2 (COVID-19), which hit the genetic lottery by sitting right at this mathematical junction point. With a Case Fatality Rate of roughly 1% and a high R0, it replicated fast enough to outrun initial immune clearance but remained mild enough to keep hosts walking, talking, and traveling. It also used the "asymptomatic spread" as a cheat code, essentially multiplying and jumping to new hosts before the immune system could trigger obvious symptoms like fever or coughing. Compare this to Rabies, which sits at the extreme, non-optimal end of the spectrum with a nearly 100% fatality rate in humans. As it is so devastatingly virulent, it effectively bombs its own transmission chain, preventing global reach. Meanwhile, a pathogen like Measles takes the opposite approach, trading away nearly all its lethality to achieve a massive R0 of 12–18, ensuring it spreads to a new host long before the current host's immune cells can clear it. In the given table, we can look at how different viruses strategize.
However, the correlation isn't always a perfect, clean seesaw because some pathogens have evolved strategies to bypass the denominator of our equation entirely. This is best explained by the Sit-and-Wait Hypothesis [2, 4]. If a pathogen can survive in the external environment for weeks, months, or even years, it no longer depends on a living, mobile host to travel. It doesn't matter if the host's immune cells lose the battle or if the host dies immediately; the math "decouples" because environmental persistence[4] acts as a permanent reservoir, allowing the pathogen to maintain high lethality and high spread simultaneously.
Ultimately, data shows us that we don't need to live in fear of every deadly pathogen. Without the right transmission mechanics to outpace or bypass host immunity, extreme lethality is usually an evolutionary dead end. But the final surprise is that evolution is a dynamic, never-ending experiment. While the trade-off hypothesis acts as a powerful constraint, we can never truly predict when a pathogen might mutate to find a new loophole to restart its calculus and achieve both high mortality and high spread. We play the game of life every day, but the viruses are the ones constantly rewriting the rules.
References & Bibliography
- [1] Anderson, R. M., & May, R. M. (1982). Coevolution of hosts and parasites. Parasitology, 85(2), 411–426.
- [2] Ewald, P. W. (1983). Host-parasite relations, vectors, and the evolution of disease severity. Annual Review of Ecology and Systematics, 14(1), 465–485.
- [3] Frank, S. A. (1996). Models of Parasite Virulence. Quarterly Review of Biology, 71(1), 37–78.
- [4] Walther, B. A., & Ewald, P. W. (2004). Pathogen survival in the external environment and the evolution of virulence. Biological Reviews, 79(4), 849–869.


